In this blog, David Tattam summarises his insights from the tenth live session "From Static to Dynamic WHS Risk Reporting" in the webinar series "A Deep Dive into Workplace Health and Safety".
In the 10th Webinar of the series we continued our deep dive in WHS by focusing on From Static to Dynamic WHS Risk Reporting. I was joined again by Michael Martin from C-Suite Safety Solutions and my Protecht colleague Brendan Stevenson, Head of Customer Analytics.
Objectives of WHS Reporting
We considered the key objectives of WHS reporting as being:
- To provide assurance that the WHS system and processes are working effectively and that the WHS risks are being adequately managed.
- To provide early warning of WHS system and WHS risk issues.
- To assist in making better decisions.
- To provide transparency.
- To increase accountability.
- To meet regulatory requirements.
A common theme throughout this Webinar series has been the importance of integrating WHS Risk Management into the wider Enterprise Risk Management (ERM) process. In ISO standard 31000 we are focusing today on Step 8: Recording and Reporting. For the OH&S ISO 45001 standard, reporting touches on all of the following areas:
- Continuous Improvement
- Monitoring, Review, Analysis, Evaluation
- Planning and Control
- Leadership & Commitment
- Policy
- Roles, Responsibilities, Authorities
- Communication
The ISO standards work as a suite of standards, designed to be integrated and therefore containing many overlaps and similarities.
What information is needed and by whom?
Within an organisation, different recipients require different information. For example the Board requires aggregated and summary data, whereas a WHS Specialist needs to be across all information.
Across an organisation, due to the sheer volume of information and data, it is important to have a single source of truth. In Protecht ERM we focus on recording the data once but use and report the data in multiple different ways.
Traditionally WHS reporting has been static, which results in many limitations, such as:
- Time lag between event and reporting.
- Provides a result only at reporting time.
- Accuracy at risk due to data entry lag.
- Inability to measure states against workflow.
- Inability to flag out-of-specification outcomes at time of non-conformance.
- Out of date and lagging follow up of outstanding issues and actions.
In the Webinar Michael Martin from C-Suite Safety Solutions discussed how critical it is that we get to a place in WHS Reporting where information is up to the minute and current.
Using the WHS PDCA (Plan, Do, Check, Act) Cycle, Michael explored how this cycle can be improved with dynamic reporting.
Using the example of a WHS Schedule, when a Schedule is set up as a Task List we see the following improvements:
- Establishment of the schedule online.
- Notifications to remind users.
- Real time reporting.
- Minimal Data entry required.
A pre-loaded schedule can then feed into dynamic reports, for example to give us a real-time view of WHS Key Performance Indicators (KPI) information that instantly updates with each new entry and is presented using colours and highlights.
If more data is collected, we can dig even deeper and gain more insights. This dynamic reporting makes it easier for people to do their day to day jobs in a timely fashion.
With this in mind we were interested to know how our webinar participants are currently gathering data and reports. Here are the results:
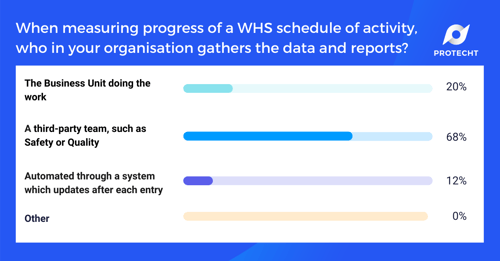
-
68% of participants have a 3rd party team, such as safety or quality gathering the data.
-
12% of participants use an automated system that updates after each entry.
These results are not surprising. Protecht's focus with the Protecht.ERM Risk System is to achieve maximum automation and as a result more dynamic, real time reporting. This move to automation has many benefits to WHS Risk Management as we have explored throughout this webinar series and will focus on in more detail in the final webinar of the series, when we look at Visualisation of concepts in Protecht.ERM: One source of data truth.
Principles of great WHS Reports
In the Webinar Brendan Stevenson, Protecht's Head of Customer Analytics discussed how you can gain insight and value from your WHS System Reporting, by asking yourself a few key questions before designing your Reports and Dashboards:
- WHY? Why are we reporting? What are the objectives?
Be clear on the objective, what action or decision is it trying to drive? Is your Report Operational or Analytical? - WHO? Who is your audience?
Know your audience, different audiences may need different information, therefore different types of Reports or Dashboards.Think about the information and how it is presented, do your abbreviations translate for example? - WHAT? What information needs to be reported and what is the best
layout? Reports and Dashboards should generally start with headline metrics or summary data and breakdowns as required. Consider how the information will change over time. Good Dashboards guide a user through the information. Avoid good looking data with no purpose!
With this in mind, we were interested to know what reporting platform our webinar participants are currently using for WHS reporting. Here are the results:
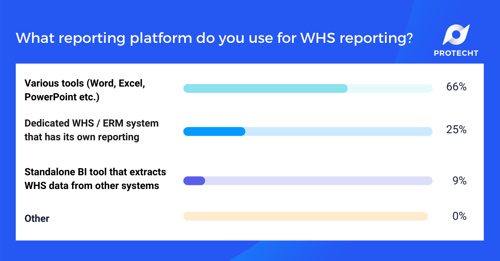
- 66% of participants are using various tools, such as Word, Excel, PowerPoint.
- 25% are using a dedicated WHS/ERM system that has its own reporting engine
- 9% of participants are using a standalone BI tool that extracts WHS data from other systems.
The Data Model
In Risk Management, we are fundamentally collecting data, turning that data into intelligence and reporting that intelligence. We have many data points, sources and types of data. Some is automated, some is manual, some is semi-automated. This raw information needs to be transformed into intelligence to give us aggregated and consolidated views that drive new insights.
When this raw data has been transformed we can move to more mature risk management reporting and start looking at:
- Algorithms - New Information, such as Composite KRIs.
- Zoning and Colours, such as application of Risk Appetite RAG (Red, Amber, Green)
- Comparisons, Benchmarking and Trends, such as bench-marking with other data and time series.
We also have the ability to create linkages between data, using central libraries and tags, which gives us more powerful and integrated reporting insights.
With this in mind we were interested to know to what degree our webinar participants' WHS information is linked to allow integrated reporting. Here are the results:
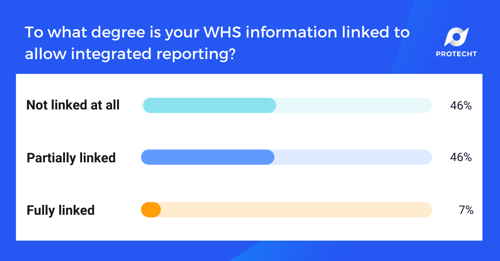
- 46% of participants WHS information is not linked at all.
- 46% partially linked.
- 7% fully linked.
The value and intelligence you can derive from linking data is phenomenal and I encourage you (if you are not already) to use a system, such as Protecht.ERM which allows for integrated dynamic reporting.
Key Reports & Analytics
As we have done in previous Webinars, we looked at some examples of key reports and Analytics that we are using at Protecht. For WHS we looked at the following:
- WHS Activity
- Safety Incidents
- Hazard Assessment
- WHS Compliance Management
- Actions Management
- Controls Management
- WHS Risk Metrics
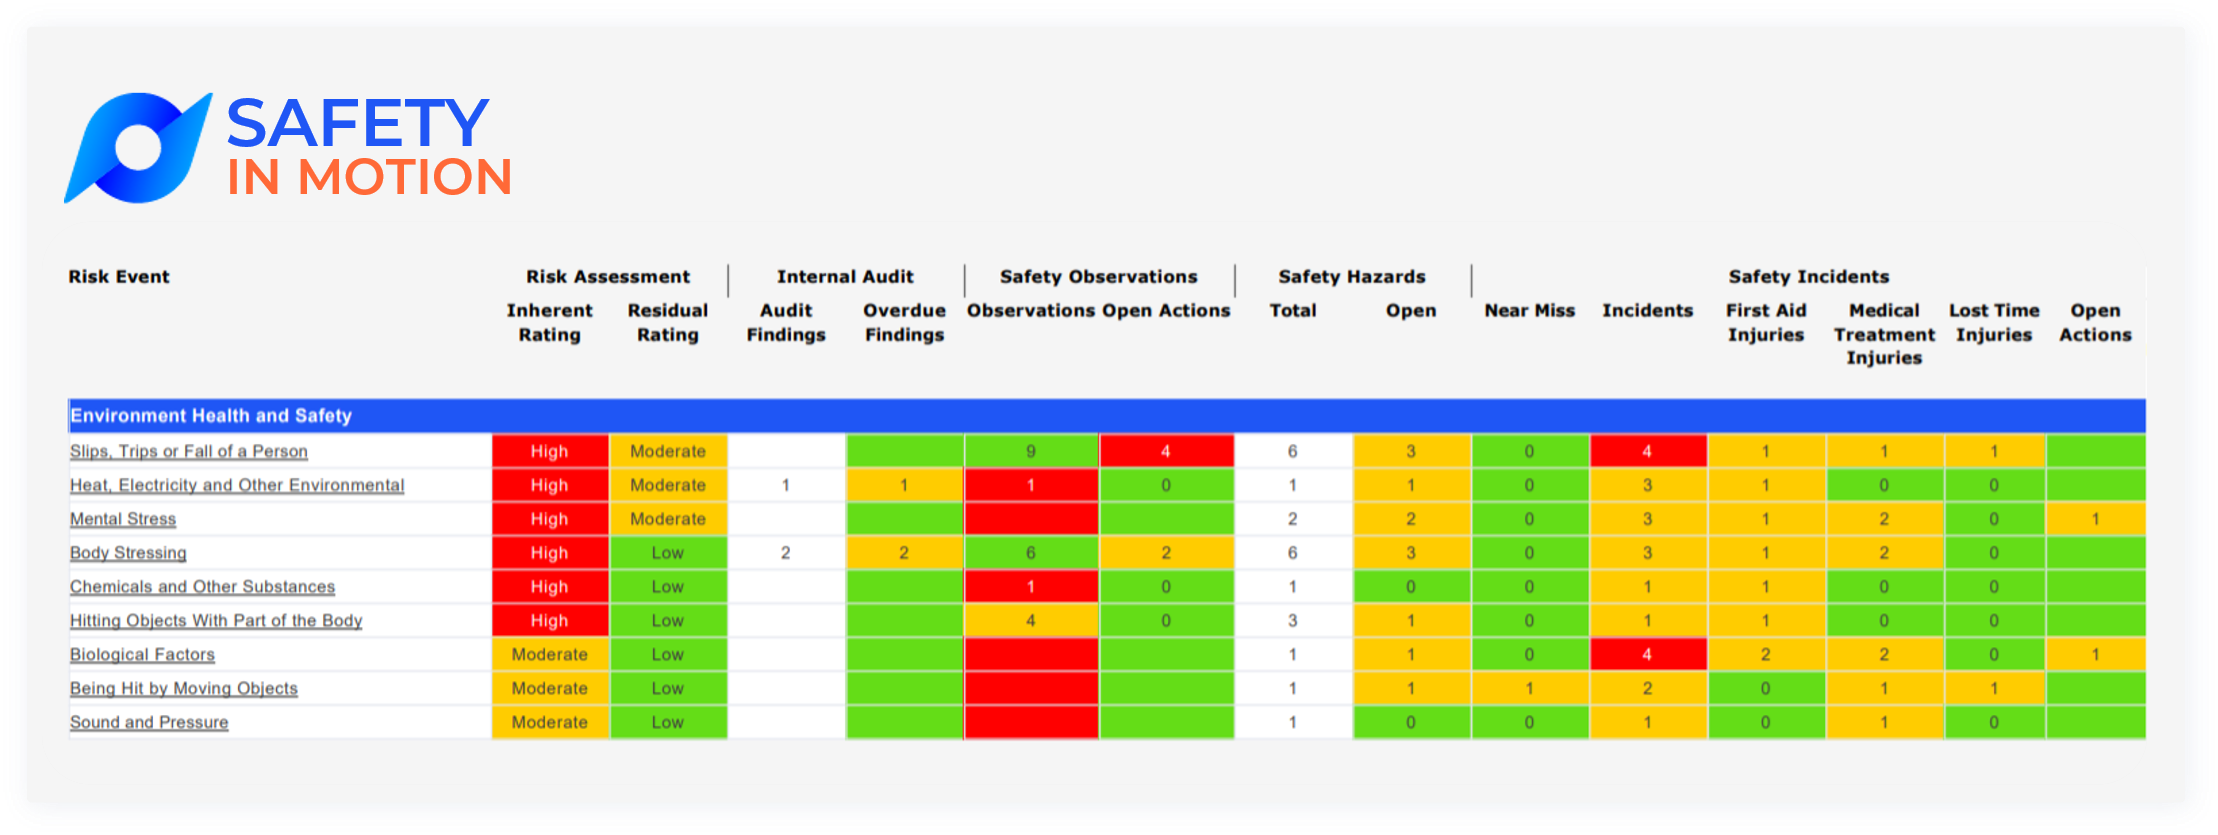
We then looked at the Risk in Motion Dashboard and the Safety in Motion Dashboard which both beautifully illustrate the power of integrated, aggregated and dynamic reporting:
In our final poll I was interested to find out, the extent to which participants' WHS Reporting is integrated and dynamic. Here are the results:
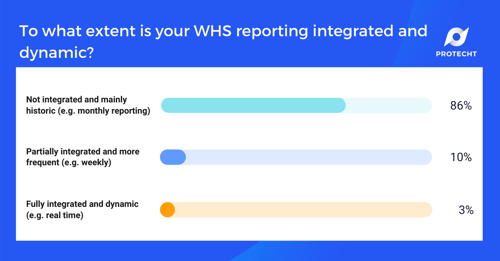
- 86% are not integrated.
- 10% partially integrated.
- 3% fully integrated.
As we have explored in this and previous webinars in the series, the more integrated and dynamic your WHS reporting is, the more powerful your insights will be. Having a system, such as Protecht.ERM which helps you to integrate and automate your reporting will help transform your data into intelligence and will make your users every day tasks much more easier to complete.
In the final webinar of the series we will wrap up our deep dive into WHS by looking at Visualisation of concepts in Protecht.ERM: One source of data truth.
To access the recording of the previous webinars and to save your spot for the final Webinar click the image below: