The first issue to consider is how the level of residual risk is assessed taking into account the scoring of inherent risk and the level of control effectiveness.
One approach is to apply subjective judgement without applying any mathematical relationship between inherent risk and the level of control effectiveness.
A second method is to apply a mathematical approach.
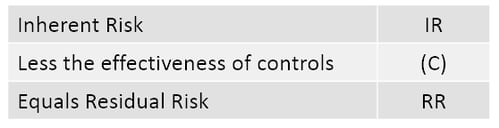
As a starting point, we can use the simple relationship that:
This analysis can be further broken down to show likelihood and consequence separately. In the following example, we have used “times per period” for likelihood and “$ impact” for consequence. A “% reduction” score has been used to assess control effectiveness.
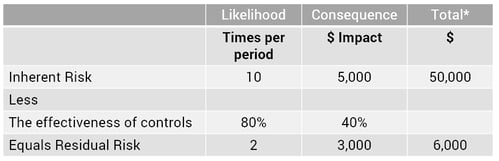
*The inherent and residual risk total is determined by multiplying the likelihood by the consequence
Where methodologies score the likelihood and consequence using standard scores, such as 1 (Low) to 5 (High), the same logic can be applied. This approach is intuitively correct once the control effectiveness score has been determined. This is the “standard” method we use in our Enterprise Risk Management software (Protecht.ERM).
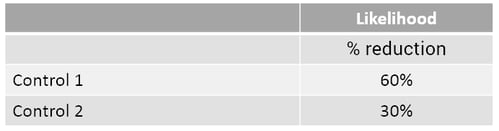
The more difficult issue is how the effectiveness of controls % reduction is determined when, as is more often the case, there are multiple controls related to a single risk. Where multiple controls exist, the overall control effectiveness score may either be determined for all controls collectively or separately for each control. Where the controls are assessed collectively, a methodology is required to “aggregate” the individual control scores. In this example we will use two controls and assess the risk reduction in likelihood only (the same logic will apply to the impact on consequence). Each control is given the following assessment as to percentage reduction.
The combined % reduction is required. This needs an understanding of how the two controls operate with respect to the risk. As a starting point, we can identify the minimum and maximum combined effectiveness %. Minimum: At a minimum, the combined effect must be the higher of the two controls i.e. 60%. Maximum: At a maximum, the combined control effectiveness can be 90%, the addition of both controls. This assumes the controls work together at the same time . We can therefore determine that the combined effectiveness will fall between 60% and 90%.
Where the controls work partially together, the combined effectiveness will fall somewhere between these levels. For example, assume that control 1 operates first and then control 2; The overall effectiveness is then:
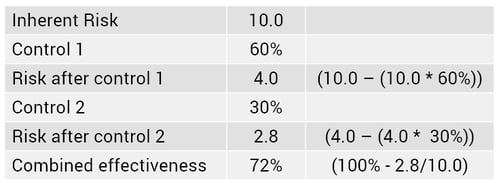
The problem becomes more complex as the number of controls increases as some controls may work together, totally or partially, while others do not.
If you do follow a more mathematical approach to risk scoring and assess controls individually, whichever method is selected it is important to appreciate that the result should be taken as a guide only. An intelligent assessment of the result should be carried out to ensure that the results are intuitive and in line with your overall assessment of the combined controls.
Want to learn more?
If you are interested in learning more, please send an email to info@protechtgroup.com.